State of the Industry: Exclusive Survey Results on Biological Products
 16 June 2020
 The biological products sector is more than a market share grab by multinational companies. It’s quickly becoming a strategic staple in the portfolios of crop input companies of all sizes around the world.
In the recent AgriBusiness Global State of the Industry Survey (methodology below), 58% of responding suppliers and distributors from 43 countries say they are integrating biological products into their portfolios, and another 21% are looking into carrying them, and 21% said they are not developing a biological strategy.
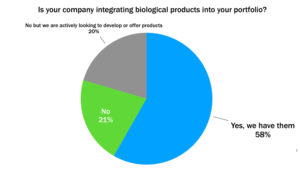
Compared with 2011 data: Just 30% of companies had biologicals as part of their portfolio, and 42% said they are not developing a biological strategy.
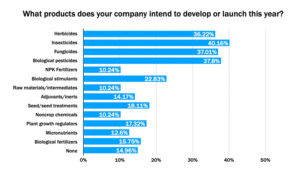
Biological pesticides are the largest category of biological products that suppliers and distributors are pursuing, and companies are launching or developing them with the same priority (38%) as traditional chemical pesticides: insecticides (40%), fungicides (37%), and herbicides (36%).


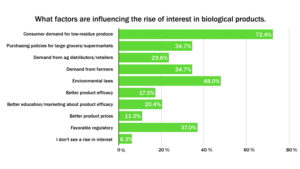
Even companies who aren’t investing in new biologicals say they are seeing increased demand: 88% of respondents say demand is rising for biological products, and consumers are the driving force behind evolving production systems; 72% of respondents say consumer demand for lower pesticide residues is the biggest reason for the surge in biological products, which is forcing the entire upstream and downstream value chain to re-evaluate production systems. Environmental laws were the second most significant reason for increased demand (48%), followed by favorable regulatory framework (37%) and demand from farmers who are complying with new purchasing strategies from large grocery retailers.
Survey Methodology and Demographics
AgriBusiness Global’s annual State of the Industry Survey and special report offers readers a biographical snapshot of the health of the industry and the sentiment of the companies that operate in it. The survey was designed by AgriBusiness Global editors and broadcast to our email subscriber base. Email reminders were sent during the four weeks the survey was open May 11-June 8, and an incentive was offered to win a $100 gift card. The survey was taken by 133 respondents in 43 countries, giving the survey a margin of error of ±8.44% with a 95% confidence level.
The survey respondents represent primarily crop protection manufacturers and formulators (55%), distributors and trading companies (27%), and plant health suppliers and distributors (17%). About 42% do not originate any molecules, and 30% do not formulate any products, indicating that trading companies and non-formulating distributors still represent a significant share of the industry.
More than half of responding companies (56%) had gross revenues of less than $25 million in 2019, which is consistent with the past 10 years. However, the number of companies who gross more than $250 million (21%) has doubled since 2009, illustrating consolidation among the largest companies in the industry.
Similarly, the number or registrations per company has increased remarkably in the last 10 years: 34% of companies held at least 50 product registrations in 2019 compared to 8% in 2009. Companies with more than 20 registration rose to 54% compared to 22% in 2010. The number of companies with zero product registrations also rose from 15% in 2010 to 23% this year. This data illustrates consolidation among larger companies and also the difficulty of more stringent and expensive regulatory environments, forcing a share of companies to abandon product registration strategies to focus on pure import/export and distribution business.
For almost 40% of respondents, their respective domestic markets represent at least 75% of their business; 29% of respondents rely on export markets for at least 75% of their businesses.