Key Insights Into Global Crop Protection Market Trends With a Focus on Southeast Asia
 26 October 2021
 The global market for crop protection products as measured from the “bottom-up” grew by close to 2% in 2020 compared to 2019. This continues the trend of a fourth year-on-year improvement such that the 2020 market globally gets ever closer to the $60 billion mark ― when measured at ex-manufacturer level and using average year exchange rates.
As a “top-down” comparison, leading company sales for 2020 (Figure 1) on balance mirrored this “bottom-up” growth estimate with strong gains by Syngenta, Corteva, and ADAMA, offset to some extent by “currency hit” taken by Bayer and BASF.
Figure 1: Full Year 2020 Sales & Growth Dynamics of Leading Companies – Global

Note: Data is presented in nominal terms and expressed on a pro-forma basis (where possible). Source: Company reports, estimates by Kynetec AgMarket Insights.
The Kynetec “bottom-up” market research is in the process of finalizing the 2021 crop year research with a calendar year estimate due early in 2022. However, from a “top-down” company sales perspective all indications are for a strong 2021 performance with all key companies posting solid results for the first half (Figure 2).
Figure 2: First Half 2021 Sales & Growth Dynamics of Leading Companies – Global
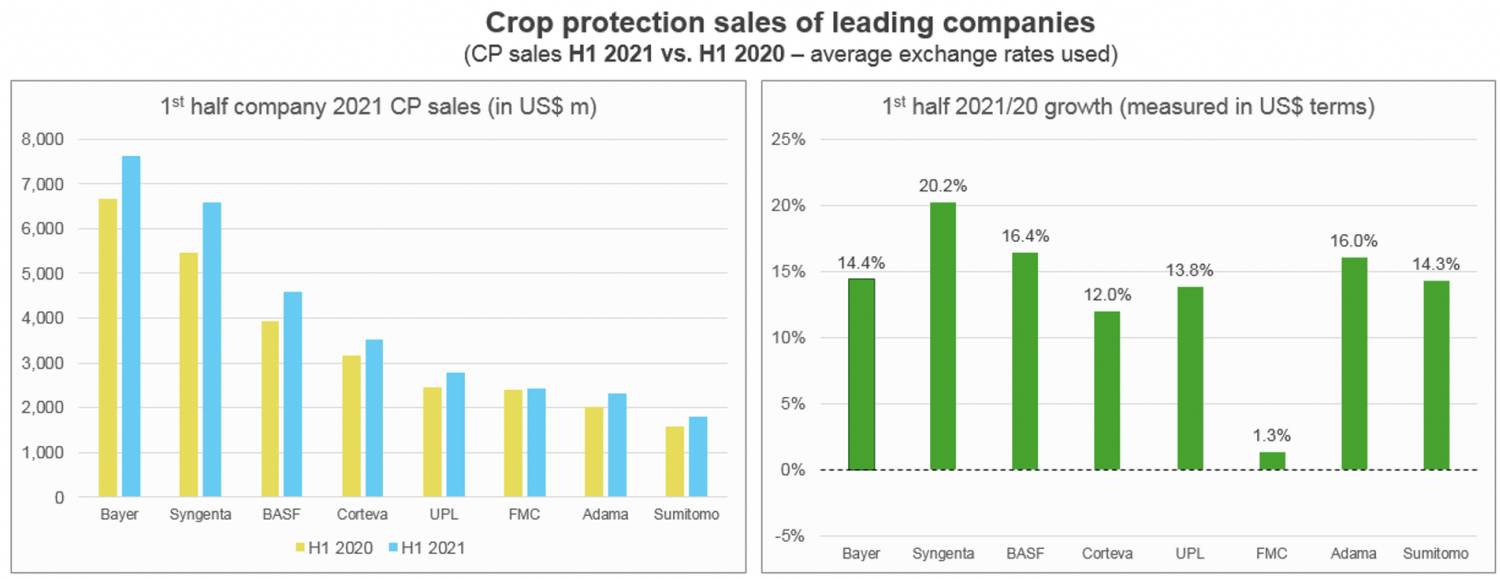
Note: Data is presented in nominal terms and expressed on a pro-forma basis (where possible). Source: Company reports, estimates by Kynetec AgMarket Insights.


Company performance in the first half of 2021 has benefited from a series of generally positive events. An improvement in crop protection product price at farm gate level was of the main contributing factors on sales if not profitability. In addition, an increased in-crop area and what can be considered as generally favorable weather conditions globally (accepting that exceptions exist) are two other positive contributing factors. Care does, however, need to be taken when extrapolating out half-year results to any estimates of full-year 2021 sales at this point.
Q3 sales are likely to be muted as some sales that would normally take place were pulled into Q2 in the 2021 season. Then, a spike in the price of raw materials and the filling of channel inventories has created, to some extent, a “wait and see” approach for what would normally be Q3 orders into Q4.
Those Q4 orders are now, however, subject to the very real specter of a global shortage of supply as China’s “dual controls” on energy consumption policies start to have meaningful impact on output. The substantial manufacturing bases within the provinces of Jiangsu and Yunnan for instance ― both being situated in the red zone ― are likely to see an ever-increasing restriction on energy provisions into Q4. Already in Yunnan, yellow phosphorus production in September reportedly has been reduced by 90%. This tightness of supply will feed through to the remainder of 2021 and into early 2022.
Beside the challenges to raw material supplies, additional global headwinds for the second half of 2021 include global inflationary pressures, a now 70%-plus chance of a return of La Niña 2021/22 for Latin America, and the looming energy crisis in much of continental Europe, which is reducing the production of nitrogen fertilizers. In addition, the ongoing “debt ceiling” debate in the U.S. threaten, among other aspects, the stability of the U.S. dollar itself. In Asia, the crisis engulfing Evergrande ― China’s second-biggest property company ― should not be ignored as anything other than a “soft-landing” of this $300 billion time bomb would send significant negative economic ripples throughout China, Asia, and the globe.
However, such apocalyptic events likely being averted, the outlook for full calendar year 2021 global protection use market remains strong with a year-on-year growth for 2021 over 2020 of low- to mid-single digit improvement.
While company sales growth dynamics on balance are likely to exceed market growth, much of the variation can be allocated to an increase in inter-company sales and the restocking of distribution channels. Assuming the avoidance of global disrupting events, the outlook for the 2022 crop protection market should remain on par with 2021 as many of the key drivers of robust commodity prices and strong demand for agricultural produce remain in place. Crystal-ball gazing into 2023 would suggest some challenges to growth, partly from disruptive technologies, commodity prices and regulatory pressures.
In addition, government-led environmental commitments will start to put pressure on certain intensive farming techniques, as well as the use of marginal land for arable cropping. As a result, arable farm incomes may be challenged, a situation that can only be partially offset by uptake of sustainability and “greening” initiatives such as carbon farming.
While geographically distant from many of those political, social, and regulatory pressures developing in other global regions, Southeast Asia is by no means immune from these drivers. The phase-out of palm oil as a raw material to produce biofuels within the EU will impact Malaysia going forward, with Germany bringing forward its own phase-out forward to 2023. Similarly, there will be an inevitable shift to crop protection product use that is not under regulatory pressure elsewhere as the region looks to protect commodity produce exports that might fail MRLs for banned chemistry in importing countries.
The U.S. EPA revoking all tolerances for chlorpyrifos and the EU recent ban on mancozeb and chlorothalonil all lead to a potential shift in product use in both Malaysia and Indonesia for instance. Aside from Indonesia and Malaysia, Southeast Asia as a sub-region is defined as including nine other countries: Brunei, Cambodia, Timor-Leste, Laos, Myanmar, the Philippines, Singapore, Thailand, and Vietnam. From the point of view of agriculture and agricultural area, however, only seven or eight of the 11 countries are of significance as indicated in Table 1. The size of the overall economy and the importance of agriculture make Indonesia the largest agricultural economy in the region by a significant margin.
Table 1. Key Statistics for the Southeast Asia Region – Ranked by Agricultural Area
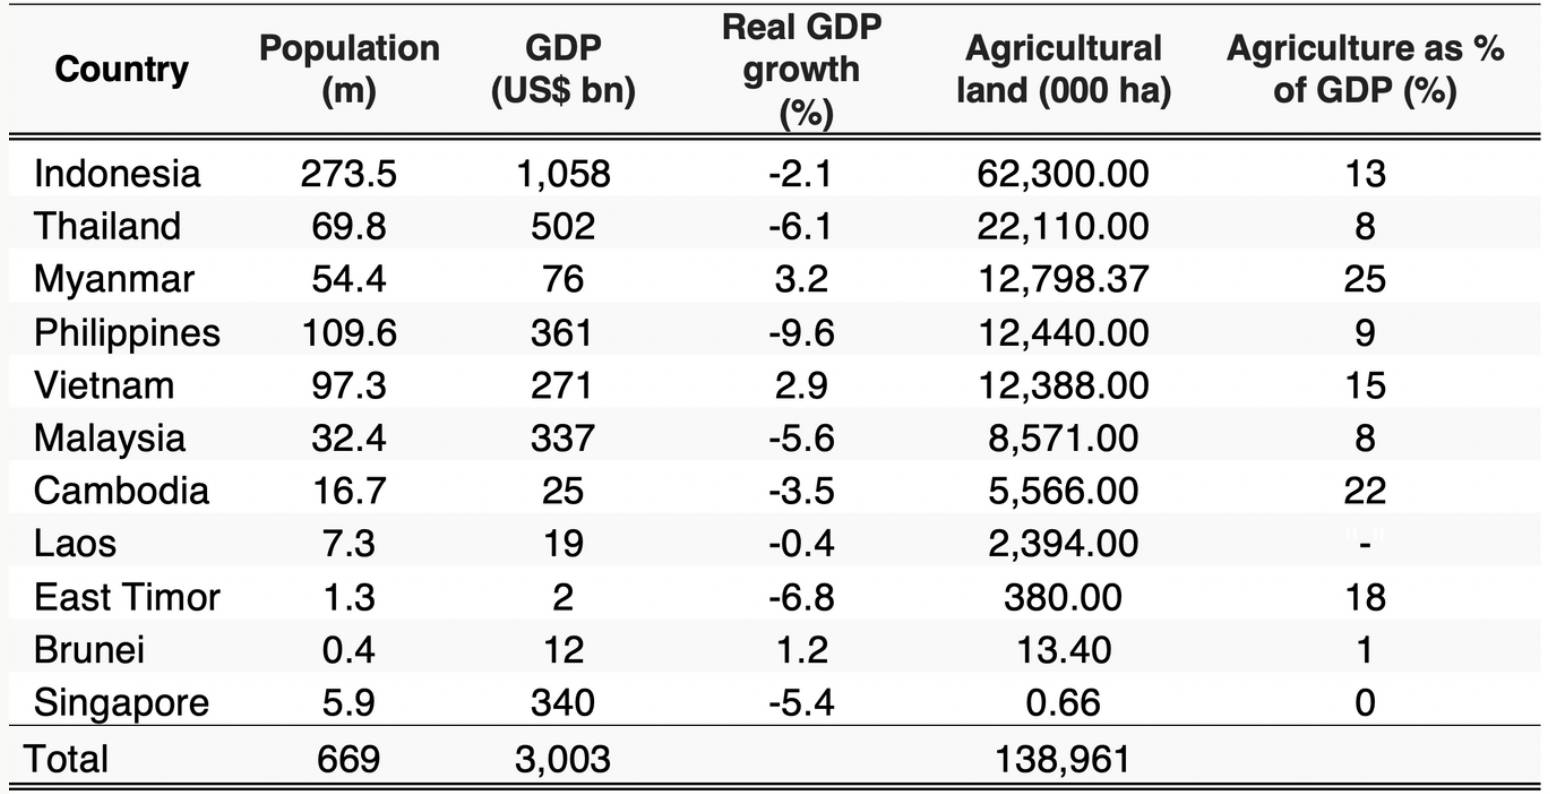
Source: Compiled from FAO, World Bank, IMF and USDA. GDP statistics are 2020 whilst Agricultural statistics are from 2019 and population from 2021. Markets of minor importance are Laos, East Timor, Brunei and the city island nation of Singapore.
That dominance in agricultural land area and economy in the case of Indonesia, however, does not equate to the largest market for crop protection; that in fact being Vietnam again by some margin.
Table 2: Value (US$m) of the Southeast Asia Crop Protection Market – 2020 (Ex-Manufacturer Level)
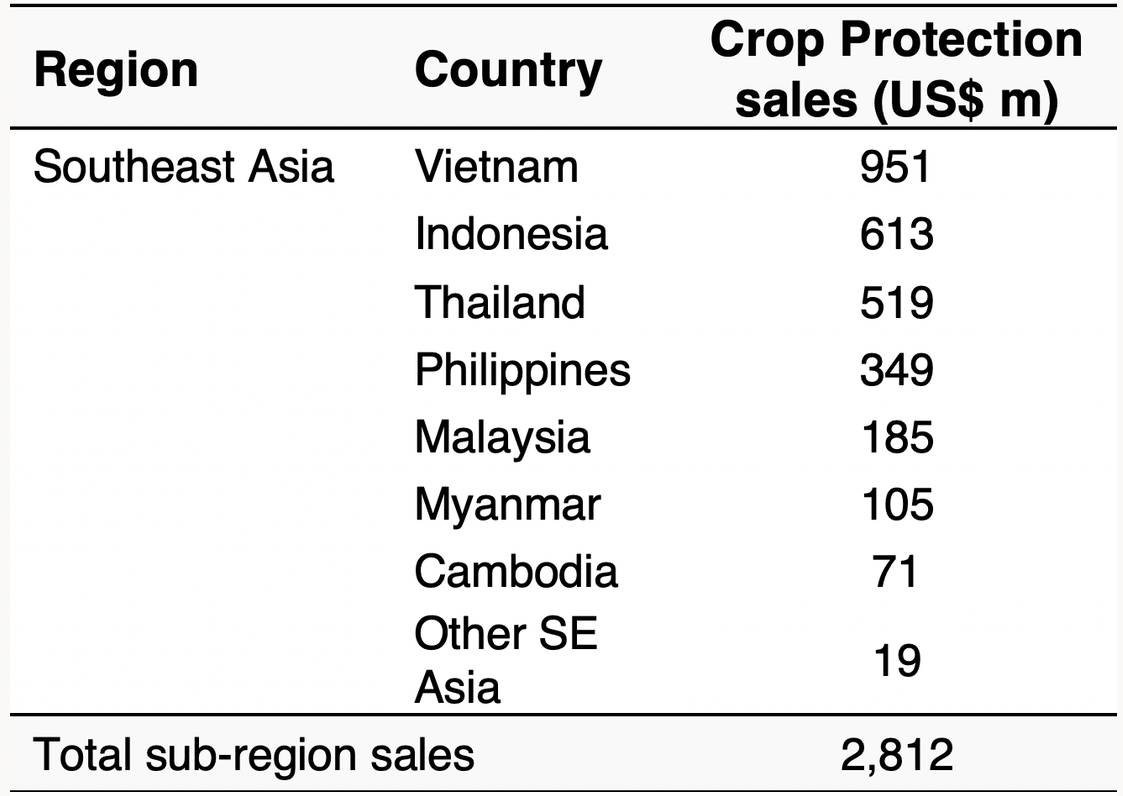
Source: SIGMA & estimates by Kynetec AgMarket Insights
The intensity of product use in Vietnam is related primarily to the importance of intensive rice cultivation in the country, which in turn accounts for close to 70% of the overall market value. That intensity of use is particularly notable with fungicides in the rice crop, but also with additional products to control Fall armyworm in maize and the spread of the pest to other crops.
Outside the dominance of rice in Vietnam and to a lesser extent Thailand and Cambodia, the types of agriculture practiced does then vary between countries. In Malaysia, for example, the plantation crops of oil palm and rubber dominate. Myanmar is different, in that although rice dominates, fruit and vegetable crops are especially important, as well as the legume crops of beans and peas and various nuts.
Indonesia is a much more diverse market, and although rice dominates once again, corn and plantation crops are also significant. The proportion of total agricultural land that can be considered as arable also ranges significantly between a high of 80% for Myanmar or Thailand to a low of just 10% for Malaysia where the plantation crops dominate.
While agriculture remains important within the Southeast Asia region, generally, national economies are moving away from agricultural-related industries. In Indonesia, heavy industries dominate the export market with coal and various forms of petroleum being of highest value. Palm oil and rubber do feature as leading exports, but of significantly lower importance compared to the energy-based commodities.
Likewise, Thailand, The Philippines, Vietnam, and Malaysia also have exports that are dominated by textiles and technology rather than agricultural products. Myanmar in 2020 was the only country in the region that had a significant proportion of its GDP from agriculture and also that has key raw agricultural commodities (in this case raw sugar and rice) as its most significant exports. The impact of the military coup at the start of 2021, however, is very likely to reduce agricultural exports going forward with growers reportedly using only one-third of the inputs in 2021 compared to previous years with a probable yield impact of -30%.
Figure 3: Southeast Asia Crop Protection Sales (2020) – Split by Country
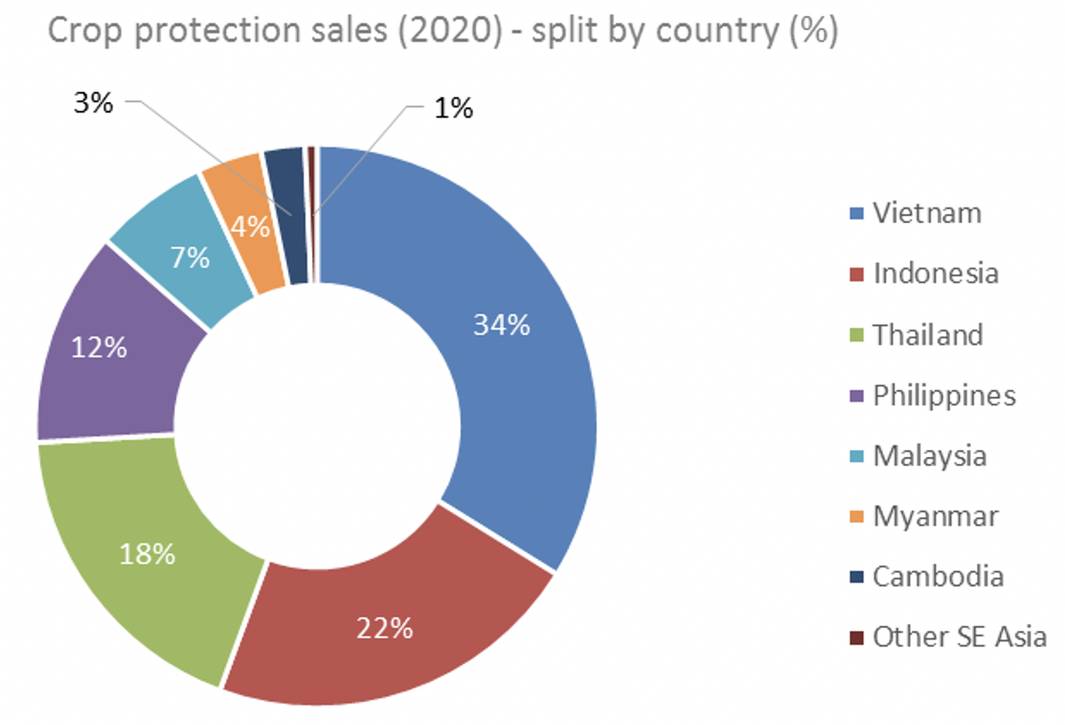
Figure 4: Southeast Asia Crop Protection Sales (2020) – Split by Crop Group
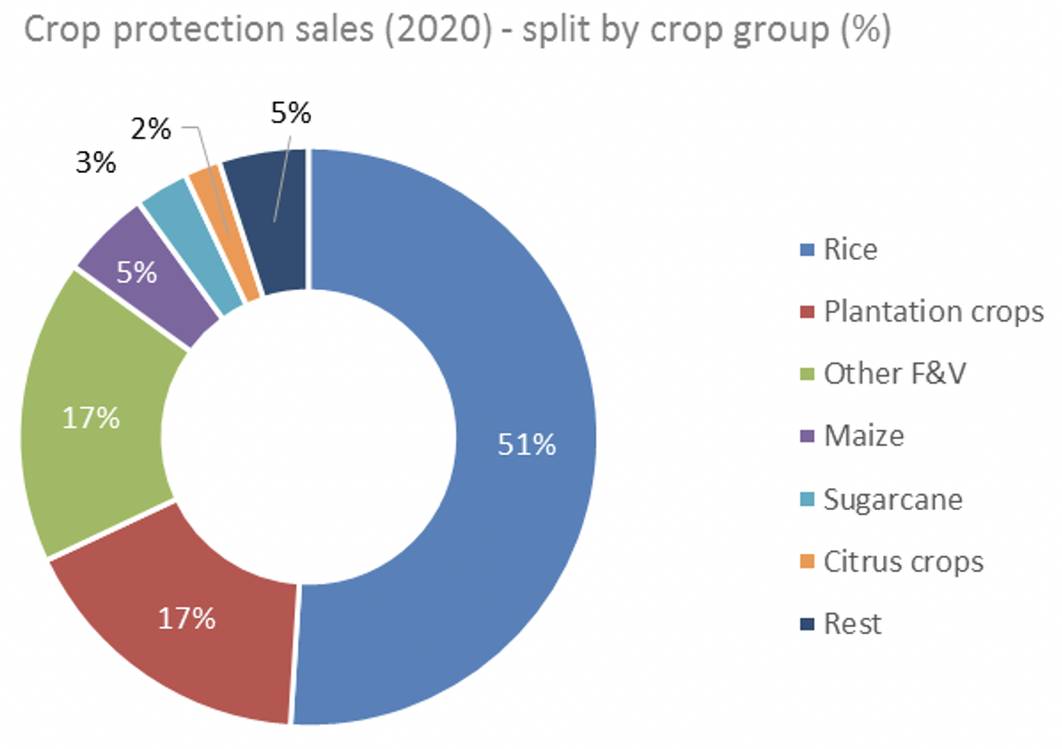
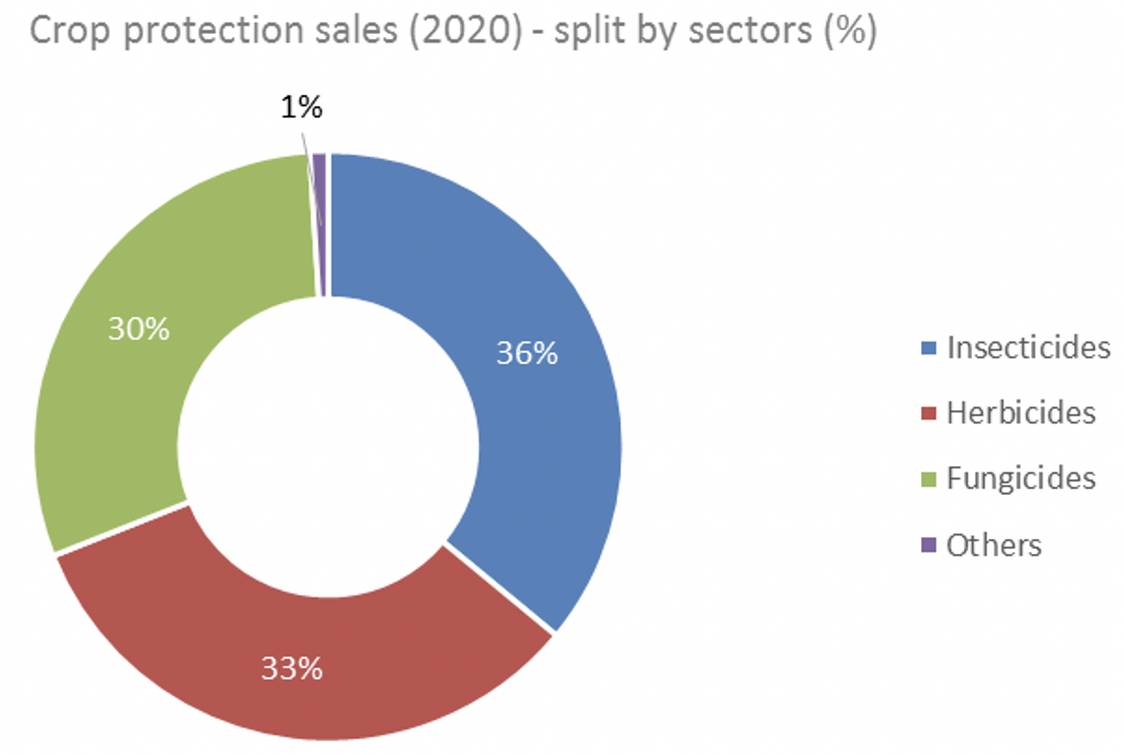
Figure 5: Southeast Asia Crop Protection Sales (2020) – Split by Sector
While the longer-term trend towards economies driven by industries other than agriculture continues, the pandemic years have reinforced the importance of agriculture as an economic safety net, while other sectors ― especially tourism ― have suffered disproportionately. This refocus, along with an improving economic picture, should help the outlook for agriculture, and in turn the crop protection industries by 2022.
The ASEAN 5 economies of Indonesia, Malaysia, Philippines, Thailand, and Vietnam are, according to the IMF, forecast to grow at 6.1% in 2022, far outpacing the global average. Added to that economic growth and generally supportive government policies, the implementation of the “free trade” Regional Comprehensive Economic Partnership (RCEP) signed at the end of 2020 should also significantly promote trade between the Southeast Asian countries and the wider Asian region. Besides RCEP, which is the largest trade block ever formed ― and reportedly the size of both the EU and USMCA combined ― the EU/Vietnam Free Trade Agreement (EVFTA) entered into force in August 2020 and this will continue to provide opportunities within the Vietnamese agricultural sector.
Kynetec’s analysis is based on data collected from farmer surveys (FarmTrak) as well as distribution surveys (Sigma) and from open-source information. The farmer surveys continue to provide the bulk of the data for our overall analysis.