Data Strategies That Sell in Ag Tech
 24 September 2026
 A few years ago, we built a model to estimate cover crop biomass from Sentinel-2 imagery. It reported an R² of 0.72. On paper, that is a good model. Good enough to put on a slide, good enough to quote to a customer.
It was wrong twice.
The first problem was how the data had been split. Ground truth came from field campaigns that took two sampling units from each field, sometimes 50 meters apart. A random train/test split lets one of those units sit in training while its twin sat in test. The model was not being asked to predict a new field. It was being asked to predict a spot almost on top of one it had already stood on.
The second problem was harder to see. Nine of the 10 satellite features the model selected were dated after the day biomass was measured, one of them by 124 days. That sounds impossible until you know how the fields are managed. Cover crops are terminated weeks or months after sampling, and our reading is that a field that carried dense biomass leaves a sharper bare-soil signature once it is destroyed. The model appeared to have learned the aftermath. For a contemporaneous estimate, it was reading the future to predict the past.
Neither of those is visible in an R² of 0.72. That is the whole problem with the number.




When we rebuilt the model and tested it properly, the score depended on what we held out:
| What we held out | R² |
| A random selection of sampling units | 0.72 |
| Whole fields | 0.47 |
| A whole cooperative, a new geography | 0.07 |
| A whole season the model had never seen | −0.13 |
The last figure is below zero. Negative R² means the model did worse than ignoring the satellite data and predicting that season’s average biomass for every sample.
Nothing about the model specification changed between those four rows. Only the question changed. Can it fill gaps between points it has already sampled? Can it handle a new field near ones it knows? A new region? A new season? All four are legitimate questions.
Which one resembles deployment depends on the product. A model sold into new regions needs geographic holdout. A model expected to work next year needs temporal holdout. A random point split answers neither, yet it is the one most likely to reach the slide because it is what a default train/test split gives you.
Rebuilt honestly, with the leakage removed and the season kept out of training for the evaluation, it recovers to 0.42. We trust 0.42 in a way we should never have trusted 0.72.
Changing what we held out moved the score by 0.85. Changing the model, a 60-day image series against a single image, moved it by 0.07.
One Model, Three Definitions of Good
The subject is a number with no units, and few industries encounter more of them than this one, where every efficacy claim, every scouting platform, and every yield-response model arrives with an accuracy figure attached that is doing less work than it appears to.
What counts as accurate changes with who is holding the model, and the changes run in opposite directions.
A distributor’s agronomy service deciding where to send scouts wants field-level flags with a few weeks of lead time. A false positive costs a half-day visit. A false negative can cost a missed application window, yield the grower will remember, and a sale. So, you tolerate a false alarm rate a researcher would be embarrassed by, and you buy detection with it.
A crop protection or biological company demonstrating product performance is asking a different question. It is not scoring individual plots. It is estimating an average response across a trial network, and a model can be good at one and poor at the other. Independent site-to-site error shrinks as sites are added, but error shared across sites that have a season, a region, or a processing version in common does not, and neither does a systematic tendency to compress the extremes. A leaderboard cannot tell you which kind you have.
A stewardship or market access function running resistance monitoring or label compliance needs defensibility. False alarms can carry compliance consequences, and traceability may matter more than lead time.
The same model serves all three, and none of them means the same thing by good.
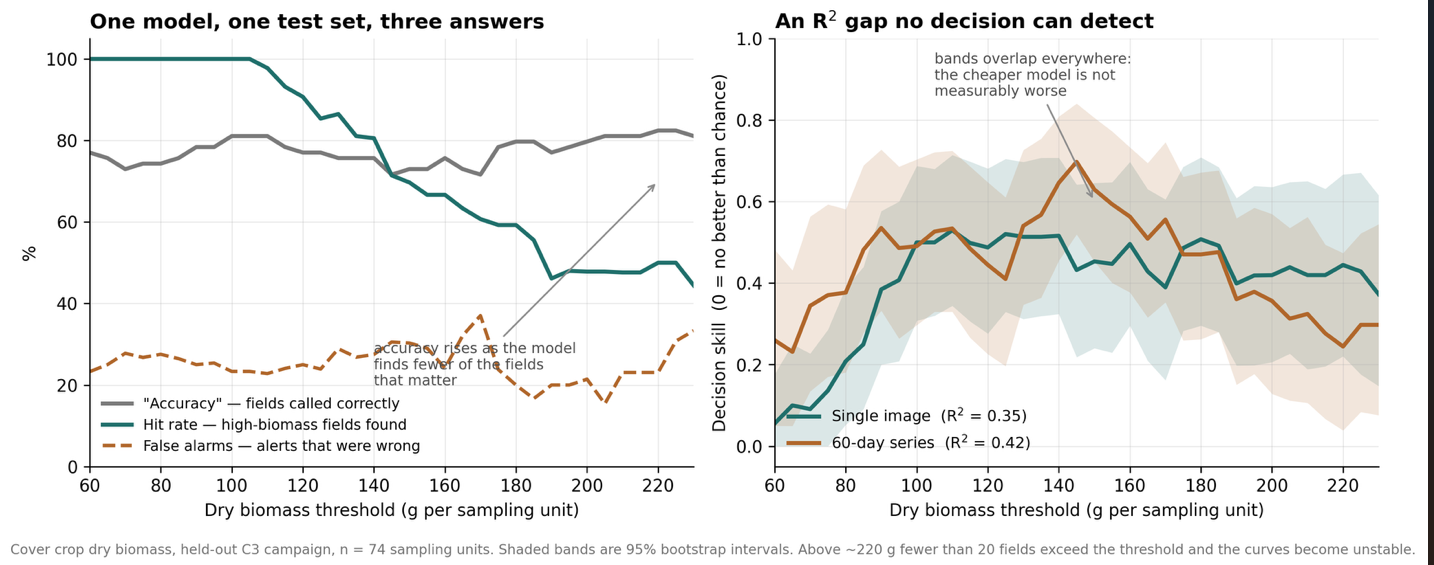
Left: One model scored three ways as the decision threshold moves, with accuracy rising as the hit rate falls. Right: Two models 0.07 apart in R², whose 95% bootstrap bands overlap across the operating range. Source: EarthDaily analysis
Better Than What?
There is a second question that gets asked even less often, and for this industry, it matters more than the first.
Every accuracy claim is a comparison, and the comparison is usually left blank. Before you can say a model is good, you need to know what it beats. By definition, an R² of zero corresponds to predicting the mean biomass of the evaluation set for every sample. For an operational benchmark, the comparison should be something available before prediction: a historical average, the previous campaign, an agronomist’s estimate, or whatever the buyer already does.
It is the version a buyer can act on because the buyer already has a way of doing this, whether that is a manual sample, an agronomist’s judgement, or last year’s program.
Read that paragraph again with a biological in place of the model, and you have the sector’s central commercial obstacle. “The product works” is not a testable claim as stated. “Under these soil, climate, and timing conditions, it delivers this much response over the incumbent program, which clears its cost per hectare” is a claim somebody can make.
Inconsistent field performance in biologicals is discussed almost entirely as a product problem. A good part of it is an evidence problem. Replication establishes that a treatment works within the environments a trial network represents, which is not the same as establishing that the effect transfers to a new geography, management system, or season.
The evidence also tends to answer the wrong comparison since response over an untreated control shows a product does something, while the purchase decision turns on what it adds over the program the grower is already running. A better strain will not fix either of those.
Four Questions
This does not make accuracy metrics useless, only incomplete. A number without a protocol is not a claim, it is a shape. So, when someone shows you an accuracy figure, four questions get you most of the way.
- What did you hold out? A random sample, a whole field, a region, a season?
- What did you beat? Not the evaluation-set mean, which is only where R² starts from but against whatever the buyer does today, in the buyer’s units.
- What was your worst case, not your average?
- What does a wrong call cost me? Only the customer can answer this since it turns on their own economics rather than on anything inside the model. It is also what makes the question useful in a room with a vendor in it.
Two suppliers can disagree about where the threshold belongs without either having to concede their model is bad. It is worth asking what your model’s documentation says.
Get The Newsletter Today!